Food and Agriculture Organization (FAO) defines deforestation as the conversion of forest to other land uses (regardless of whether it is human-induced).
‘Forest area net change’ is the sum of all forest losses (deforestation) and all forest gains (forest expansion) in each period. Net change, therefore, can be positive or negative, depending on whether gains exceed losses or vice versa.
Deforestation continues but at a lower rate
An estimated 420 million ha of forest has been lost worldwide through deforestation since 1990, but the rate of forest loss has declined substantially. In the most recent five-year period (2015–2020), the annual rate of deforestation was estimated at 10 million ha, down from 12 million ha in 2010–2015.
Losses and gains
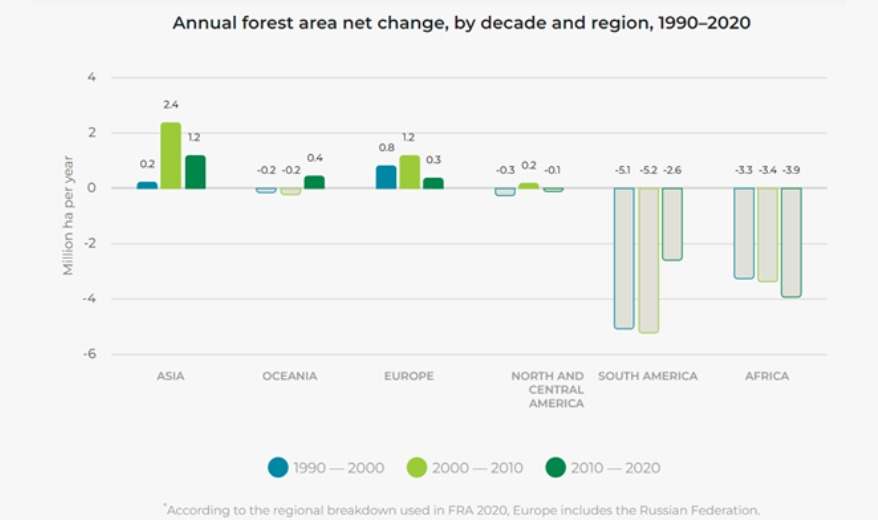
Where is the forest being lost and where is it being gained?
- Africa had the largest annual rate of net forest loss in 2010–2020, at 3.9 million ha.
- The rate of net forest loss has increased in Africa in each of the three decades since 1990.
- Annually, South America had a net forest loss of 2.6 million ha in 2010–2020.
- The rate of net forest loss has declined substantially in South America, to about half the rate in 2010–2020 compared with 2000–2010.
- Asia had the highest net forest area gain in 2010–2020.
- Oceania experienced net losses of forest area in the decades 1990–2000 and 2000–2010.
Impact on deforestation by soy, palm, timber, and oil commodities
The following figure presents the contribution of EU consumption to deforestation risk for each commodity (palm oil, soy, cattle, cocoa, coffee, and wood). EU consumption during the period 2008-2017 was responsible for 19% of the tropical deforestation embedded in the international imports of the six commodities selected in the product scope (6% if domestic consumption of producing countries is considered).
Fig: Contribution of imported consumption to risk of deforestation for selected commodities (average period 2008-2017 in thousands of hectares per year; only countries larger than 10% are shown in the charts for individual commodities). Source: own elaboration based on data from Pendrill et al (2020). (RoW: rest of the world).
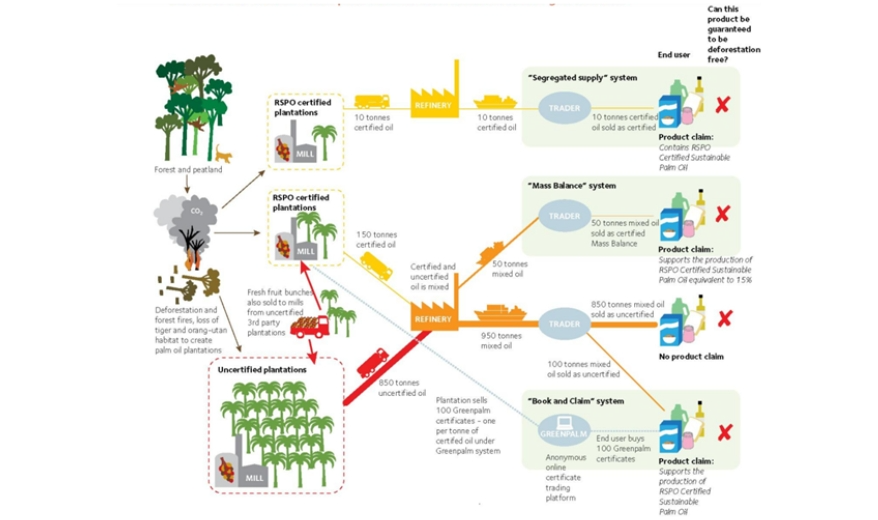
Palm oil supply chain in practice
Responsible palm oil supply chain
- Benefits of Deforestation-Free Practices: An infographic summarizing the environmental, social, and economic benefits of sustainable practice.
World’s forest cover
Did you know that forests cover nearly 1/3 of land globally? That’s 4.06 billion hectares. In other words, there is around 0.52 ha of forest for every person on the planet. More than half (54 percent) of the world’s forests are in only five countries –the Russian Federation, Brazil, Canada, the United States of America and China.
Stats around new agricultural land made of forest
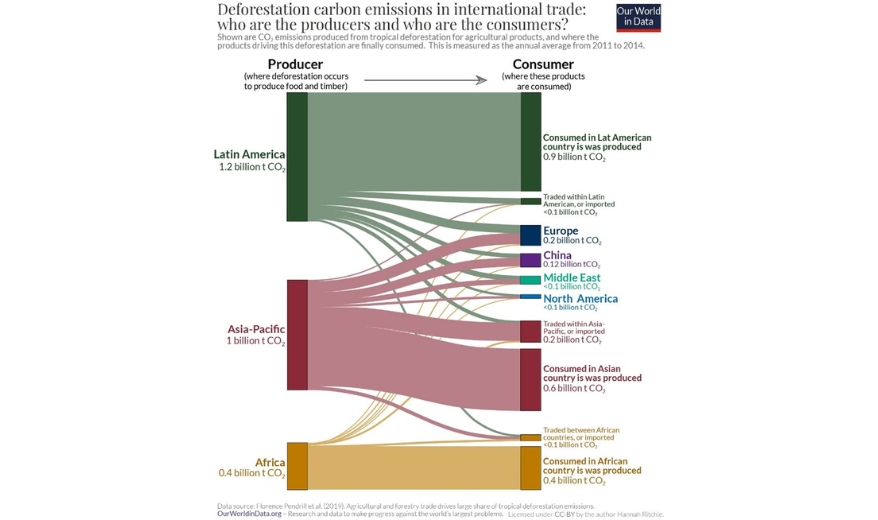
In the above chart, we see how emissions from tropical deforestation are distributed through international supply chains. On the left-hand side, we have the countries (grouped by region) where deforestation occurs, and on the right, we have the countries and regions where these products are consumed. The paths between these end boxes indicate where emissions are traded — the wider the bar, the more emissions are embedded in these products.
Latin America exports around 23% of its emissions; that means more than three-quarters are generated for products consumed within domestic markets. The Asia-Pacific region—predominantly Indonesia and Malaysia—exports a higher share: 44%. As we will see later, this is dominated by palm oil exports to Europe, China, India, North America, and the Middle East. Local populations and markets mainly drive deforestation in Africa; only 9% of its emissions are exported.
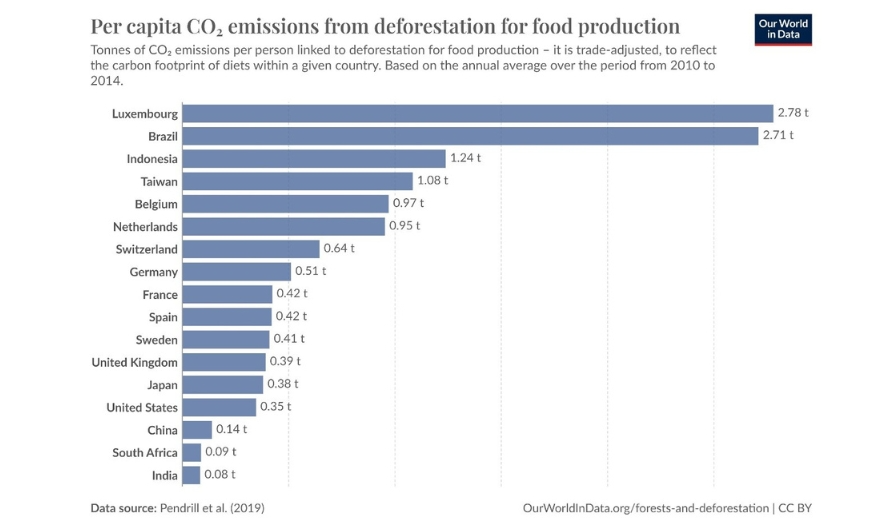
Instead of focusing on total figures by country (which are available in our map), we have analyzed the per capita footprint to better understand the impact of the average person's diet. It's important to highlight that this calculation specifically measures emissions from tropical deforestation and does not encompass other emissions from agricultural production, such as methane from livestock or rice, or the use of fertilizers.
The chart shows deforestation emissions per person, measured in tonnes of CO2 per year. For instance, the average German produced 510 kilograms of CO2 per person from domestic and imported foods.
At the top of the list, we find Brazil and Indonesia, major producer countries. The high per capita emissions after trade indicate that a significant portion of their food products are consumed domestically. The diet of the average Brazilian creates 2.7 tonnes of CO2 from deforestation alone, surpassing the country's CO2 emissions from fossil fuels, which are around 2.2 tonnes per person.
Some countries that import a lot of food also show high emissions. Luxembourg has the largest footprint at nearly three tonnes per person, while Taiwan, Belgium, and the Netherlands have imported emissions of around one tonne per person.
The average across the EU was 0.3 tonnes of CO2 per person. To put this in perspective, this would represent approximately one-sixth of the total carbon footprint of the average EU diet.
Stats around the EU imports quantities of products such as palm oil, soy, beef, and timber
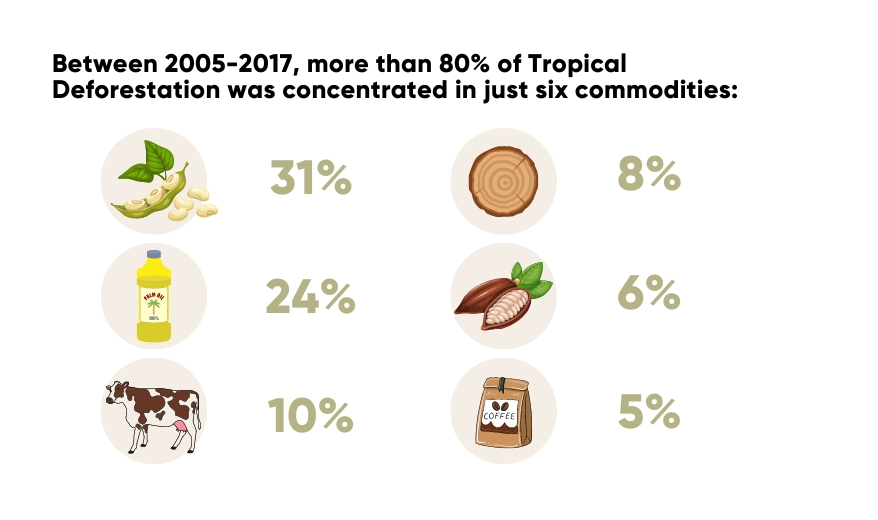
In the period between 2005 and 2017, more than 80% of tropical deforestation related to EU imports was concentrated in the following categories - soy (31%, 89,000 hectares deforested per year), palm oil (24%, 69,000 hectares), beef (10%, 28,000 hectares), wood products (8%, 22,000 hectares), cocoa (6%, 18,000 hectares), and coffee (5%, 14,000 hectares) (Figure 3). In 2017, the ranking changed with palm oil products (42%, 85,000 hectares) surpassing soy (17%, 34,000 hectares), followed by wood products (9%, 22,000 hectares), coffee (9%, 18,000 hectares), cocoa (8%, 16,000 hectares), and beef (5%, 11,000 hectares). In terms of embedded emissions, palm oil consistently surpasses other commodities, contributing 37% of embedded emissions between 2005 and 2017 due to the conversion of forests and peatlands. (Source: WWF 2021)